THE DYNAMIC EARTH: A BLOG ABOUT GEOLOGY AND THE EARTH SCIENCES

Thursday, May 29, 2008

Chugwater

Two posts in one-day! I must be jacked up on coffee something fierce!

Anyway, I was going through my photos from the recent industry-sponsored field trip to Wyoming, and I realized I had taken some panoramas that needed some stitching, stat. So I put a pot of coffee on, started up Photoshop, and got to work (as an aside, using a computer is, for me, an experience I would best describe as "harrowing"). I persevered, however, and present the fruits of my labor, below.


Anyway, this panorama is of the Triassic Chugwater Formation, exposed at the Alcova Reservoir in Wyoming (which is a completely awesome place, I might add). I expect Jeannette, who was also on the field trip, might start posting some stuff too, so I'll wait and see what she puts up before going into to much detail on the trip (I know that both of us got some pretty slick pictures, too).

Anyway, the Chugwater Fm is largely composed of silts and fine sands, and has been seriously messed up by a fair bit of gypsum. Sed structures are very rare, sadly. On the plus side, it is really really really red. Separating the lower Chugwater from the upper Chugwater is the Alcova Ls, representing a phase of shallow-water, carbonate-rich lake sedimentation that contrasts with the heavily oxidized, pedogenically-altered alluvial and fluival intervals of the rest of the formation. Unfortunately, we didn't get to spend much time looking at the unit on the trip, as we were focused on hitting the underlying Pennsylvanian Tensleep Sandstone.

Anyway, if you find yourself with some time in Wyoming, I would heartily suggest checking out the Alcova Reservoir. Rent yourself a boat at the marina and go for a paddle; there are a lot of really nifty exposures in the area.

Martian Soils

I just got back from an industry-sponsored field trip, so you’ll have to forgive the hiatus and somewhat tardy posting on the Phoenix Mars Lander. I was actually out on the interstate, driving home from a post-trip trip when I heard on NPR that the Phoenix had survived the landing and had successfully begun transmitting. Exciting stuff, especially since this mission is explicitly going to be looking into the possibility for ice in the shallow subsurface.

A particularly rad picture, released by NASA and posted below for your eyeballs’ enjoyment, shows the polar Martian landscape, with some VERY interesting polygonal structures. I reckon that those images got some folks back at mission control into quite the tizzy.

Compare that image from (holy smokes!) MARS to a picture I snagged from University of Idaho’s soil orders website (below). This image was taken somewhere up in Alaska, and shows one of the classic features of an ice-influenced soil (a gelisol, by soil science terminology): polygonal structures caused by cycles of ice growth and decay.

All this talk of Martian “soils” raises interesting terminological issues, however, that are relevant to the terrestrial geology community as well. What, exactly, is a soil? And, more to the point, how are soils preserved in the rock record?

Next time on the Dynamic Earth, we’ll dive into the nitty gritty of soil classification schemes, both ancient and modern!

Wednesday, May 14, 2008

Hippo-turbation

When I started this blog, waaaaaaay back in February, I did a post about the Okavango delta, a geomorphically/stratigraphically contentious little piece of real estate in Botswana. A comment under that post, by Brian of Clastic Detritus fame, mentioned his curiosity regarding any studies that had looked at the sedimentological and geomorphic effects of some of the charismatic megafauna in the region. Well, I recently ran across a paper that addresses just that, so I thought I’d share (there’s a full citation at the end of the post, and if anyone actually wants the paper, I’d be happy to e-mail them a pdf).

McCarthy et al. (1998) state that hippopotamus in the Okavango play an important part in the geomorphology of the distributary system, primarily for the following reasons:

1) Hippos are big

2) In order to get that big, Hippos eat a lot of grass, which they prefer to get in the form of short grasses that they keep cropped by their constant grazing.

3) Hippos are gregarious, so they’re a bunch of them in any one spot

4) Hippos hang out near channel, preferentially.

That’s a pretty comprehensive list of hippo characteristics, if you ask me. Because of these attributes, Hippos have the tendency to move around in search of food, forging paths through the vegetation that are maintained by continuous hippo traffic.

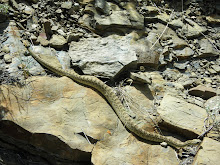
The authors point out that there are lots of big grass eating critters running around in groups in the Okavango (such as Elephants or Water Buffalo). The important difference between the trails of these critters and the trails of Hippos lies in their different ecologies. Elephants and Buffalo are primarily trying to get from island to island, so their paths through the swamps and backwaters of the Okavango tend to cut perpendicular to the regional gradient. Hippos like to stick close to the water, and so they tend to produce trails that parallel their favorite trunk channels and therefore, run parallel to the regional slope. The picture below is from page 49 of the Mcarthy et al. (1998) paper, and shows the short, parallel trails of more terrestrial vertebrates being cut be long trails running from left to right; these trails are hippo paths.


Because of the parallel-to-regional-slope nature of the hippo trails, the authors posit that these artificial channels, kept free of vegetation by hippo activity, could play an important role in channel avulsion. Their evidence here is a little sparse, though they cite a historical avulsion in the delta that they infer to be hippo-mediated, at least in part.

In addition to channels, Hippos also tend to produce cleared paths in the lakes and quiet-water regions of the Okavango. The picture below, form page 51 of McCarthy et al. (1998), shows a hippo track in a dry lakebed in the delta region.


It would be nice, of course, if someone would go through and survey in the cross-sections of these hippo-channels, both within the course of a single season as well as across multiple seasons. Detailed sedimentology in the channels would also be a nice touch, particularly if you could demonstrate a hippo channel getting utilized as a major sediment routing pathway in the delta region.

And I think it’s good to keep in mind the important lesson of this sort of work: the word Hippo-turbation is hilarious. And at the end of the day, hilarious jargon is all that really matters.

McCarthy, T.S., Ellery, W.N., and Bloem, A., 1998, Some observations on the geomorphological impact of hippopotamus (Hippopotamus amphibius L.) in the Okavango Delta, Botswana: African Journal of Ecology, v. 36, p. 44-56.

Tuesday, May 13, 2008

Sediment Transport Movies

Just a quick post to bring to light a pretty neat resource on the ol' internets that I just found. Maybe you guys already know all about it, but Paul Heller (at the University of Wyoming) has a pretty slick Sediment Transport Movies website. The movies are a nice collection of both field and flume sediment transport processes, and cover a wide range of settings. The subaqueous debris flow is a particular favorite of mine. I've placed this one in my "Resources" tab to the right.

Anybody know of any other kick-ass sed movie sites out there?

Sunday, May 11, 2008

SEED and Plate Tectonics

SEED magazine is, in my opinion, one of the better “science popularization” publications out there. I appreciate the emphasis on the intersection of science and people, and the fairly “global” viewpoint the writers often have. And, of course, I am a fan of their large science blogging community, and especially their Earth Science flavored blogs like Green Gabbro and Highly Allochthonous. Sometimes there might be a bit too much reductionism for my tastes, but all in all, I like SEED.

That being said, I have a bit of a problem with a recent feature in their most recent issue (No. 16, May/June 2008).

On page 38 of this recent issue, SEED has published another one of their “Curve of…” features. These are graphical representations that attempt to show the evolution of scientific ideas through time. The X-axis is time, and the Y-axis is a pretty goofy list of “achievements”, apparently increasing in awesomeness upwards. This month’s graph is on plate tectonics, and I’ve scanned it in below for you guys. Gaze upon it, and despair.

Grim stuff, huh? I’ve got a pile of annoyances to go over, so buckle up.

First, and a little nitpicky-ish perhaps: look at the y-axis on the graph. Guys, as geologists, we really need to start trying harder to get plate tectonics into those textbooks! I think undergrads are ready for it, and it’s a pretty good idea and all.

…That is just plain silly! Plate tectonics, the unifying paradigm of all of the Earth Sciences (and beyond), isn’t “one for the textbooks”, eh SEED? Unless your textbooks are being written by Expanding Earthers, I reckon Plate Tectonics is going to get at least a passing mention in an introductory earth science textbook. Beside the fact that tectonics is featured rather heavily in both textbooks AND the literature, SEED itself has already published one of their Crib Sheets for plate tectonic, which sort of implies it’s a fairly big-deal concept. I guess they forgot about that.

The step up from the “textbook” metric is a “free trip to Sweden”; too bad you can’t win a Nobel Prize in geology, huh? Kinda makes that one a difficult step up for their curve.

Another problem I have is the ridiculous linearity of these graphs. If you look at the graph title, SEED makes it known that they are plotting a curve “Because science doesn’t always follow a straight line to discovery”. Despite that, this is exactly what they are doing. They graph the idea of plate tectonics as a progression from a “scribble” all the way up to “one for the history books”. That still implies a uniform progression from the start to the end, as if the vast corpus of science were itself winding its way down the inevitable path of discovery. That’s a pretty Victorian view of science, if you ask me. Interestingly, if you look at the points on their curve, they only ever identify spots where plate tectonics was getting a boost OR hanging out at a plateau; the big valley in their graph (years 1930-1955 or so) isn’t explained. I guess everybody just took a sabbatical or something.

Of course, all of these little complaints really point to the fundamental problem with this graph, namely that it posits that Plate Tectonics has always been some sort of platonic ideal that we’ve been working on. Wegener was not working on plate tectonics. He made some good observations, came up with a problematic and poorly explained mechanism to explain it, and then died tragically trying to make more observations. Others came later, made some more observations, started asking questions that the current geosynclinal model couldn’t explain, and through time began to construct alternative explanations and models. SEED’s pre-Kuhnian view of science is nonsensical in its linear arrangement of work that was only subsequently assembled into plate tectonics. The “curve” of plate tectonics is only visible in hindsight, and SEED is trying to place some weird metric on a fluid, rapidly changing concept that sure as hell didn’t exist in the form it does now in the 60’s, let alone in Wegener’s time.

As a final point, I’d also like to note how North American-centric this graph is. Naomi Oreskes book, “The Rejection of Continental Drift”, pretty clearly demonstrated how European geologists were very comfortable with continental drift in the late 1800’s and early 20th Century. If you did this same goofy exercise on “Plate Tectonics” from a European perspective, you’d end up with a very different graph, which goes a long way to explain how stupid this curve idea is.

It’s a pretty poor graph, an incredibly obtuse view of both plate tectonics and science and general, and a fairly galling example of why more people don’t think of Geology as one of the “hard sciences”. For shame, SEED. For shame.

Friday, May 9, 2008

Swaley Cross-Stratification Solidarity

Brain, over at Clastic Detritus ,has posted a nifty picture of some sweet, sweet Swaley Cross-Stratification. To show some solidarity, I too will post a couple of pictures of some SCS I’ve collected. Actually, both of these pictures are from the Book Cliffs, as well. If you ever find yourself in and around Price, Utah, I suggest you grab a map, your rock hammer, and a camera, and just spend some time wandering around all the BLM land and its fantastic geology.

The picture below has some SCS nicely exposed in the lower right of the outcrop; actually, if you trace the lower bounding surface over to the left a ways, you can just start to see it transition into hummocky cross-stratification. As Brian pointed out in his post, these two bedforms are often associated with one another. In fact, these bedforms are so characteristic, that they have often been evoked as “typical” of storm deposits. In some of the literature, HCS and SCS are often interpreted as unequivocal evidence for tempestites.


This next picture shows another nice little swale, hanging out with some structureless and planar laminated sands.


The SCS is all good and well, and some may be tempted to slap an interpretation of a storm-bed on there, but darned if some of the surrounding sands aren’t lookin’ an awful lot like some T a-b turbidites (with just the massive and planar laminated sections preserved of the more traditional Bouma sequence). But I thought SCS meant storms!?! Aren’t we in the middle-to-upper shore-face!?!

As Brian points out in his post, the flow hydrodynamics of these bedforms are related to high energy and rapid sedimentation. Dumas and Arnott (2006, Geology, p. 1073-1076) have further gone on to quantify the specific flow hydrodynamics related to these settings, demonstrating that oscillatory-dominant combined flow (meaning both back-and-forth AND directional currents) are responsible for the production of these bedforms. While it is true that storm currents can (and do) produce these bedforms, these same hydrodynamic conditions can also be produced by other processes, such as turbidity currents! The picture above is actually from a portion of the Book Cliffs recording the progradation of one of the famous clastic wedges, and there are turbidites and (potential) hyperpycnites associated with this interval.

Things are never as easy as they seem, and that goes double for facies models.

Friday, May 2, 2008

Debris Flows...Caught On Tape!

Ol' G.K. Gilbert once said that there are three events that all geologists have to experience in their lives: a glacier, a volcanic eruption, and an earthquake. Its a good list, don't get me wrong, but I think I'd have to add "Debris Flow" into the mix (maybe between volcano and earthquake, in terms of difficulty).

Brian, in a comment on the previous post, makes the rad suggestion of a Fan Cam, set up in some debris flow prone region; heck, a few checks every month, for a decade or so, and I reckon we'd catch a few good ones. Until then, however, I have videos of debris flows and hyperconcentrated flows that I have lovingly harvested from the bounty that is YouTube.

The videos below are all from a single USGS film on Debris Flow Dynamics, and are narrated by John Costa, who was one of the big wheels in the USGS debris flow hazard group. The footage is a little iffy in some spots, and there are some clearly turbulently supported hyperconcentrated flows (which are pretty different from cohesive debris flows) thrown into the mix, but all in all, its pretty slick. There is also a more recent debris flow video put out by the USGS that has some awesome footage from China; if I can find it, I'll post it up later.

Now, onto the films!

PART THE FIRST


PART THE SECOND


and, PART THE THIRD

Thursday, May 1, 2008

Death Valley Alluvial Fans!

Well, after witnessing my computer engage in Windows Vista-related computer seppuku, I am finally getting back to the ol’ blogging. And there is no better way to celebrate a return to the internets than through alluvial fan pictures.

During our Death Valley trip, we were lucky enough to see lots and lots of examples of alluvial fans, both stratigraphic (which I posted about earlier) as well as geomorphic. Today, I’ll share some pictures of some modern fans.

Alluvial fans, as you may or may not know, are a controversial subject. In the bad old days, researchers had a tendency to synonymize alluvial fans with braided rivers, effectively assuming that fans were extensions of the fluvial depositional model. Once the continuum of deposition had been set between Rivers and Fans, workers had to apply some intellectual contortionism in order to explain the disparate morphologies seen today. This trickled down into stratigraphic work, where humid-fan and dry-fan models were promulgated, and often used to justify incredibly complex paleoclimatic reconstructions based on this fan-moisture dichotomy.

A paper published in JSR, Blair and McPherson (1994) stands out as the counterpoint to this view, and points to several lines of evidence that distinctly define alluvial fans as discrete depositional environments that display marked hydrodynamic and stratigraphic differences from fluvial systems. These characteristics of alluvial fans include such things as fan slope (which is on average ~1.5°-6°, as opposed to the maximum of 0.4° or so for fluvial deposits), association with tectonically active range fronts, and the dominance of debris-flow and sheetflood depositional processes on fans.

Anyway, the two camps still rip each other’s throats out on occasion, which always makes for a fun time at conferences and in the Discussion-Reply literature. But enough of that! Let’s look at some pictures!

The picture below was taken from up top of Mosaic Canyon, looking down towards the parking lot at the trail head. You can see an older fan surface, abandoned and subsequently dissected by short channel networks. I think this picture displays nicely one of the problems in sedimentary geology, namely relating geomorphology to stratigraphy; If you were just walking along, trying to figure these things fan-shaped things out, you might be tempted to equate the surface process you are currently observing (the channelized system) to the formation of the fan itself. In reality, however, the geomorphic system observed has nothing to do with the deposition underneath, and represent the superposition of an erosive system over older deposits.

This next picture shows some active, coalescing fans; just goes to show you how much sediment is getting dumped out of these systems!

The third picture is pretty slick, if I say so myself. It shows an uplifted fan surface that has been subsequently trenched, which is acting to focus the incised channel a younger alluvial fan that is prograding out into the valley floor. The juxtaposition of active and inactive fans is a common feature, both in space and in time, which can make the stratigraphy of these things sort of complicated. This also might be a good example of the formation of growth strata, with different generations of fan deposits showing different dips as movement along the bounding fault readjusts the system, resulting in a “fan” of fan-strata that records this tectonic activity.

The fourth and final picture in this series is one of my favorite, though I can’t take credit for the photography skills on display. This picture below is a cropped picture taken by a fellow field tripper wielding a bajillion-dollar camera (which is why the shot looks so nice). This is an active (and probably fairly “recent”) debris flow that has slipped down this fan, depositing a remarkably coarse apron of sediment. And do you notice the band of REALLY coarse material in the center of the flow? Note that is has a fair number of big clasts, sort of floating there at the top of the flow. I’d interpret that to be the viscous plug of a flow, sitting right there, WAITING to be photographed. How cool is that!?!
NEAT!